Pivot tables are powerful tools for summarizing data in Excel. However, a common challenge arises when you need to count the unique occurrences of items within your data, rather than just the total number of entries. For instance, you might want to know how many distinct customers made a purchase in a specific region, or how many unique products were sold by a particular salesperson. While Excel’s standard pivot table functionality doesn’t offer a direct “Unique Count” feature, this guide will walk you through an effective method using the Data Model, available in Excel 2013 and later versions.
Understanding Unique Counts
A unique count, also known as a distinct count, identifies and tallies each unique item only once. This is different from a standard count, which simply tallies every entry. For example, if a salesperson appears multiple times in a region, a standard count would include each instance, while a unique count would only register them once for that region.
Video Tutorial and Step-by-Step Guide
This tutorial provides both a video demonstration and written instructions to guide you through the process. The key to achieving a unique count lies in adding your pivot table’s source data to the workbook’s Data Model.
Three Steps to Show Distinct Count
Follow these three main steps to display a distinct count in your Excel pivot table:
Step 1: Create Pivot Table with Data Model
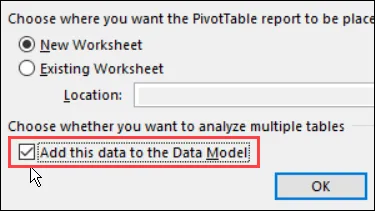
Begin by creating your pivot table, ensuring you enable the Data Model option.
- Select Data: Click on any cell within your source data table.
- Create PivotTable Dialog: In the “Create PivotTable” dialog box, locate the option at the bottom to “Add this data to the Data Model.” Crucially, ensure this checkbox is selected.
- Confirm: Click “OK” to generate a blank pivot table.
Step 2: Add Fields to Pivot Table
Next, configure the layout of your pivot table by adding the relevant fields.
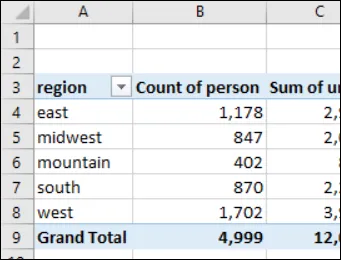
- Add Region to Rows: In the pivot table, drag the “Region” field to the “Rows” area.
- Add Fields to Values: Drag the “Person,” “Units,” and “Value” fields to the “Values” area.
- Since the “Person” field contains text, it will default to a “Count of Person.” This count represents the total number of transactions per region, not the unique number of individuals.
Step 3: Get the Distinct Count
The final step is to change the calculation type for the “Person” field to achieve a distinct count.
- Right-Click: Right-click on any value within the “Person” field in your pivot table.
- Value Field Settings: From the pop-up menu, select “Value Field Settings.”
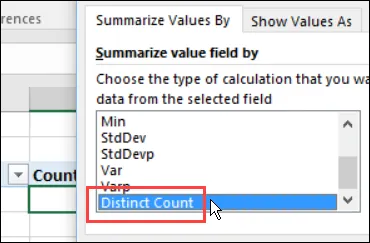
- Summarize Values By: In the “Value Field Settings” window, ensure you are on the “Summarize Values By” tab.
- Select Distinct Count: Scroll to the bottom of the calculation types list and select “Distinct Count.”
- Confirm: Click “OK” to apply the change.
Completed Pivot Table – Unique Count
After applying the “Distinct Count” setting, the “Person” field in your pivot table will update. It will now display the distinct count of salespeople’s names for each region, rather than the total number of transactions. Duplicate entries for the same salesperson within a region will not be counted multiple times.
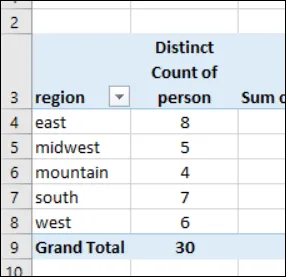 Distinct Count of person names
Understanding Data Model Limitations
It’s important to note that using the “Distinct Count” feature requires your pivot table’s source data to be added to the Data Model. This process creates an OLAP-based pivot table, which comes with certain limitations compared to standard Excel pivot tables. Features such as grouping by date or number ranges, and using calculated items, are disabled in OLAP-based pivot tables. For more detailed information on OLAP features and limitations, you can refer to Microsoft’s documentation.
If you prefer not to use an OLAP-based pivot table, alternative methods for obtaining a unique count are available.
Alternative Methods for Unique Counts
For scenarios where the Data Model is not suitable, or if you are using an older version of Excel, consider exploring other techniques for calculating unique values.
Download Sample File
To practice these steps, you can download a sample workbook that includes the data and the configured pivot table. This file, named pivottableuniquecount_dm.zip, is in .xlsx format and does not contain macros.
About the Developer
This tutorial was developed by Roger Govier, an Excel MVP based in the UK. Roger specializes in Excel and VBA assignments for clients worldwide, focusing on efficient and straightforward solutions. You can find more of his tutorials and sample files on his website.
Stay Updated with Excel Tips
Subscribe to Roger’s monthly newsletter for quick Excel tips, news, and more.