
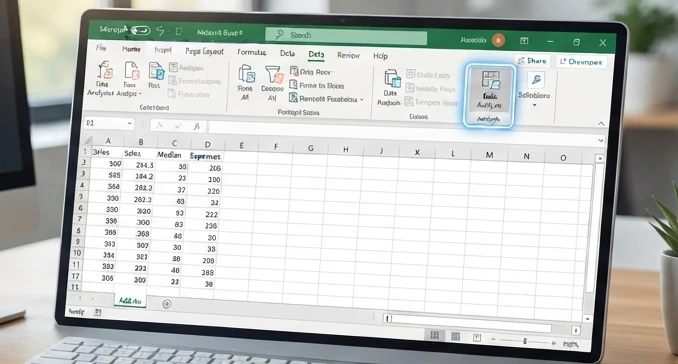
- Open Excel and select File.
- Go to Options, then Add-ins.
- Choose Excel Add-ins and click Go.
- Check Analysis ToolPak and select OK.
- Open the Data tab and select Data Analysis.
If the Data Analysis button is missing in Excel 365, the issue is usually that the built-in Analysis ToolPak add-in has not been activated or the current Excel version does not support it. This guide shows how to enable the ToolPak, find its analysis commands, run common statistical workflows, and troubleshoot availability problems.
Introduction to Excel Data Analysis ToolPak
The Analysis ToolPak extends Microsoft Excel beyond formulas and basic charts by providing ready-made statistical analysis procedures. It is designed for users who need structured calculations and output tables rather than building every statistical method manually with spreadsheet formulas.
The add-in is useful for office users, students, analysts, and business professionals working with datasets that require summaries, comparisons, or relationship analysis. It does not replace statistical judgment: ToolPak output still needs to be interpreted based on the question being investigated and the quality of the underlying data.
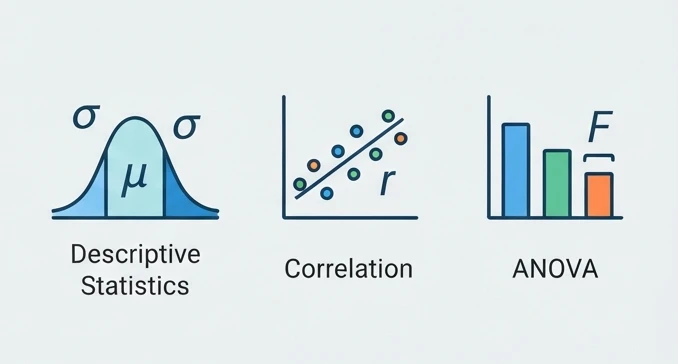
Common uses include summarizing a dataset with Descriptive Statistics, examining relationships with Correlation or Regression, comparing groups with ANOVA, creating distributions with the Histogram tool, and analyzing time-based patterns with Exponential Smoothing or moving averages.
Compatibility depends on the Excel environment. Desktop versions of Excel generally provide the full add-in experience, while Excel for the Web has more limited support for desktop-style add-ins and analysis features.
Enabling the Analysis ToolPak in Office 365
Learning how to install Excel Data Analysis ToolPak starts with confirming that you are using the desktop Excel application. The activation path differs between Windows and Mac, so following the correct menu sequence avoids searching for options that are not available in your version.
Windows activation steps
To enable ToolPak in Office 365 on Windows, use the Excel Add-ins menu:
- Open Microsoft Excel and select File.
- Choose Options.
- Select Add-ins.
- At the bottom of the window, locate the Manage box, select Excel Add-ins, and click Go.
- Check the Analysis ToolPak box.
- Select OK and wait for Excel to load the add-in.
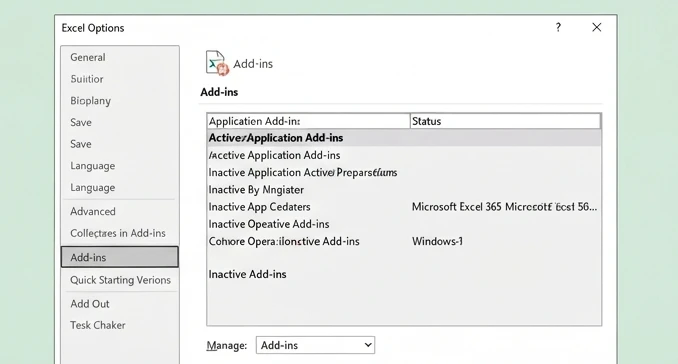
After activation, open a worksheet and select the Data tab. The Data Analysis button should appear in the Analysis group on the ribbon. Selecting it opens the list of available statistical tools.
If the button does not appear immediately, close and reopen Excel. The add-in loads into the application rather than becoming a separate program.
Mac activation steps
Excel for Mac uses a different route for enabling the Analysis ToolPak. The exact menu labels can vary slightly between releases, but the process generally follows the Excel Add-ins path:
- Open Excel on macOS.
- Select the Tools menu.
- Choose Excel Add-ins.
- Select the Analysis ToolPak option.
- Confirm the selection and return to the worksheet.
Once enabled, check the Data tab for the Data Analysis command. If the command is missing, verify that the workbook is open in the desktop Mac application rather than Excel for the Web.
Troubleshooting Activation Issues
When the Analysis ToolPak is not available, diagnose the problem by checking where the failure occurs. The missing option may be caused by an inactive add-in, a ribbon display issue, or an unsupported Excel environment.
- Check the add-in list and confirm that Analysis ToolPak remains selected in the Excel Add-ins window.
- Restart Excel after enabling the add-in so the ribbon can refresh.
- Confirm that you are using desktop Excel instead of Excel for the Web when looking for the Data Analysis button.
- If Analysis ToolPak is not listed, use the available browse or installation prompts in the Add-ins window to locate required components.
A common failure pattern is that the add-in appears enabled but the button is still missing. In that case, check the ribbon customization settings and verify that the Data tab is visible. The observable sign of a successful activation is a Data Analysis command appearing in the Data tab.
From an editorial review of spreadsheet workflows, the recurring failure mode is treating every missing button as an installation problem. First identify whether the add-in is missing, disabled, hidden, or unavailable in the current Excel version.
Using Data Analysis Tools in Excel
Once the ToolPak is active, the next challenge is choosing the right analysis tool. The best choice depends on the decision you need to make, not simply on which statistical feature appears most advanced.
Tool selection guide
| If | Then |
|---|---|
| Need to summarize a dataset | Use Descriptive Statistics to generate measures such as averages and spread summaries |
| Want to measure relationships between variables | Use Correlation to examine whether variables move together |
| Need to estimate relationships between variables | Use Regression to model how one variable relates to another |
| Require comparison of multiple group means | Use ANOVA to compare groups statistically |
A safer way to use Excel statistical analysis tools is to define the question before selecting the tool. For example, a sales team asking whether advertising spending relates to sales needs a relationship model, while a manager reviewing monthly performance may only need a summary of averages and variation.
Descriptive statistics, regression, and histogram workflows
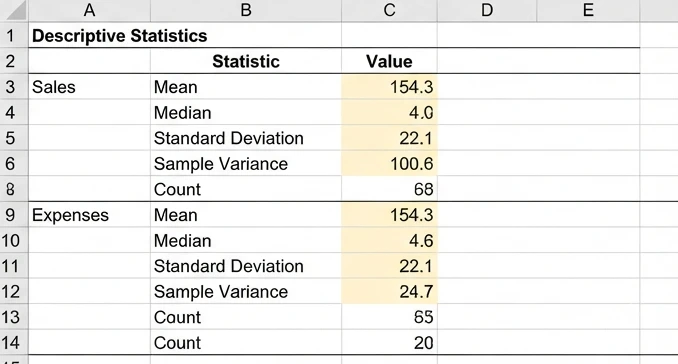
Descriptive Statistics is often the best starting point because it provides a quick overview of a dataset. Select a data range, choose Descriptive Statistics from the Data Analysis menu, select an output location, and generate the summary table. Review the output to understand the dataset’s central values and variability before moving to more complex analysis.
The Histogram tool is useful when the goal is understanding how values are distributed. It requires an input range and optional bin settings that define how values are grouped. The output helps identify whether data clusters around certain ranges or whether unusual values require further review.
A Regression analysis workflow follows a different purpose: estimating relationships. For example, a business analyst wants to examine whether advertising spend can help predict sales.
Situation: A user wants to predict sales based on advertising spend.
Steps:
- Select the input range containing advertising spend and sales data.
- Open Data Analysis and choose Regression.
- Set the input ranges, choose an output location, and select OK.
- Review the generated regression table and use the statistical results to evaluate the relationship between the variables.
Result: Excel produces a regression output containing the model information and statistical measures needed to evaluate whether advertising spend is associated with changes in sales. The output supports analysis, but it does not prove that advertising alone causes sales changes.
For ANOVA, the decision rule is different. Use ANOVA when comparing multiple groups and asking whether their average results differ beyond what random variation might explain. The Anova: Single Factor tool can analyze data from two or more samples and test whether samples may come from the same underlying distribution.
Comparing Analysis ToolPak Across Excel Versions
The Data Analysis ToolPak experience changes depending on whether you use desktop Excel, Mac Excel, or a browser-based version. Checking the platform first prevents wasted time searching for features that are unavailable.
Excel version comparison
| Version | Available Tools | Functionality | Limitations |
|---|---|---|---|
| Desktop Excel | Descriptive Statistics, Correlation, Regression, ANOVA, and other ToolPak features | Full desktop add-in workflow | Requires desktop application access |
| Excel for Mac | Core ToolPak statistical tools through the Mac add-in path | Supports many desktop analysis workflows | Menu paths differ from Windows |
| Excel for the Web | Limited Excel web features | Browser-based spreadsheet editing | Some advanced add-in functions may not be available |
Office 365 Excel and perpetual-license desktop versions can have differences depending on the installed application build. A practical check is to open File and look for application settings that identify whether Excel is installed locally or running in a browser.
Feature Differences
The main distinction is not only the subscription name but the application environment. Desktop Excel loads add-ins into the application, while Excel for the Web focuses on browser-based editing and collaboration.
If a user cannot find Analysis ToolPak after following desktop instructions, the first diagnostic question should be: Am I using the installed Excel application or the browser version? The visible sign of the web version is that Excel opens inside a browser tab rather than as a desktop program.
XLMiner Analysis ToolPak is one third-party alternative for users who need additional analysis capabilities. It should be considered when built-in ToolPak features do not cover a specific workflow, not simply because the standard add-in is unfamiliar.
Advanced ToolPak Features and Applications
Beyond basic summaries, the Analysis ToolPak supports several methods used in spreadsheet modeling and practical decision-making. The key is matching the tool to the type of uncertainty or comparison involved.
Sampling methods can help users examine a subset of data instead of processing an entire dataset manually. Moving average calculations are useful for smoothing time-series fluctuations and identifying broader patterns.
In practical spreadsheet modeling, the easy-to-miss step is checking whether the data structure matches the selected tool. A regression model needs clearly defined input and output variables. A correlation analysis requires numerical variables that can reasonably be compared. A histogram requires values that can be grouped into meaningful ranges.
Business analytics applications may include forecasting trends, comparing performance groups, or evaluating relationships between operational measures. Academic users may apply ToolPak features for coursework involving statistical interpretation. In every case, the output is a calculation aid rather than an automatic conclusion.
VBA can also be used to automate spreadsheet workflows involving repeated analysis tasks. Automation is useful when the same procedure must be performed regularly, but users should verify that automated steps still match the intended analysis question.
The strongest workflow is usually:
- Define the analytical question.
- Prepare and check the dataset.
- Select the ToolPak feature that matches the question.
- Review the output and interpret it in context.
A simple action you can take today is to open the desktop Excel application, enable Analysis ToolPak from the Excel Add-ins menu, and run Descriptive Statistics on a small worksheet dataset; this confirms the add-in is active and shows where future analysis results will appear.
FAQ
Can I use the Analysis ToolPak in Excel for the Web?
Excel for the Web has more limited support for desktop-style add-ins and analysis features. For the full Analysis ToolPak experience, use the desktop Excel application where the add-in can be activated through the Excel Add-ins menu.
What should I do if the Data Analysis button is not visible after enabling the ToolPak?
First confirm that Analysis ToolPak is still selected in the Excel Add-ins window, then restart Excel to refresh the ribbon. If the button is still missing, check that you are using desktop Excel and that the Data tab is visible.
How do I choose the right statistical tool from the Analysis ToolPak?
Choose the tool based on the question you need to answer. Use Descriptive Statistics for summaries, Correlation for relationships between variables, Regression for estimating relationships, and ANOVA for comparing multiple group means.