Understanding relationships between data sets is essential in statistics, business analysis, and academic research. For example, as a person’s height increases, their weight often increases as well. This type of relationship is called a positive correlation. However, knowing that two variables are related is not enough—you also need to measure how strongly they are connected.
That is where the Spearman Rank Correlation becomes useful. In Microsoft Excel, you can calculate the Spearman Rank Correlation Coefficient to determine the strength and direction of a relationship between two ranked variables. This guide explains the concept, formula, advantages, and step-by-step methods to calculate Spearman rank correlation in Excel.
What Is Spearman Rank Correlation?
The Spearman Rank Correlation Coefficient is a non-parametric statistical measure used to identify the strength and direction of association between two variables. Unlike Pearson correlation, Spearman correlation works with the ranks of the data rather than the original values.
This method is especially useful when:
- The data is ordinal
- The relationship is monotonic
- The dataset contains outliers
- The variables are not normally distributed
The coefficient is represented by rs or ρ (rho).
Range of Spearman Rank Correlation Coefficient
The Spearman coefficient always falls between -1 and 1.
- 1 indicates a perfect positive correlation
- -1 indicates a perfect negative correlation
- 0 indicates no correlation
Here is how to interpret the values:
- A monotonically increasing relationship produces a coefficient close to 1
- A monotonically decreasing relationship produces a coefficient close to -1
- If the data increases and decreases inconsistently, the coefficient approaches 0
- A value of 1 means both variables increase together perfectly
- A value of -1 means one variable increases while the other decreases perfectly
- A value near 0 suggests no meaningful relationship
Advantages of Spearman Rank Correlation
The Spearman correlation test offers several practical benefits for data analysis in Excel:
- Works well with ordinal data
- Resistant to the influence of outliers
- Does not require normally distributed data
- Suitable for non-linear but monotonic relationships
- Easy to calculate using Excel formulas
Because it uses ranks instead of raw values, unusual observations do not distort the final result as much as they do in Pearson correlation analysis.
Spearman Rank Correlation Formula
The standard formula used to calculate the Spearman coefficient is:
rs=1−6∑di2n(n2−1)r_s = 1 – frac{6sum d_i^2}{n(n^2-1)}rs=1−n(n2−1)6∑di2
Where:
- rs = Spearman Rank Correlation Coefficient
- di = Difference between the ranks of paired values
- n = Number of observations in the dataset
Important: This formula only works correctly when there are no tied ranks in the dataset. Each variable should contain distinct values.
Example of Valid and Invalid Datasets
Valid dataset:
- Variable 1: [1, 4, 3, 5]
- Variable 2: [3, 4, 2, 5]
Invalid dataset with duplicate ranks:
- Variable 1: [1, 2, 2, 2]
- Variable 2: [3, 4, 2, 5]
The second dataset contains duplicate values in Variable 1, which prevents the direct formula from being applied accurately.
Excel Functions Used for Spearman Correlation
Before calculating the coefficient, you should understand two important Excel functions.
RANK.AVG Function in Excel
The RANK.AVG() function assigns a rank to a number within a dataset.
Syntax
excel
=RANK.AVG(number, ref, order)
Parameters
number: The value whose rank you want to calculate
ref: The full dataset range
order:
1for ascending order0for descending order
This function is essential for converting raw data into ranked data before applying the Spearman formula.
CORREL Function in Excel
The CORREL() function calculates the Pearson correlation coefficient between two arrays.
Syntax
excel
=CORREL(array1, array2)
Parameters
- array1: First dataset
- array2: Second dataset
Although CORREL() normally calculates Pearson correlation, it can also calculate Spearman correlation when you apply it to ranked data instead of raw values.
Method 1: Calculate Spearman Rank Correlation Using the Formula
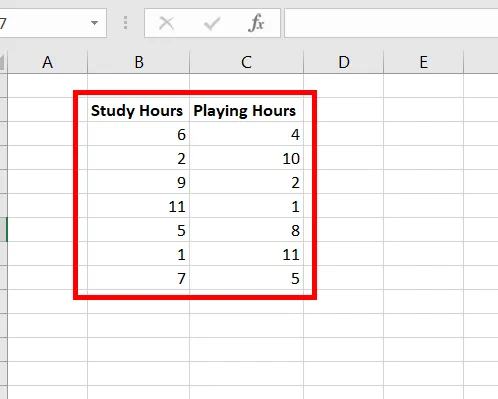
In this example, a student tracks her daily study hours and play hours for seven days to determine whether the two activities are positively or negatively correlated.
After entering the dataset into Excel, follow these steps carefully.
Step 1: Create the Study Rank Column
Add a new column called Study Rank.
In cell D3, enter:
excel
=RANK.AVG(B3,$B$3:$B$9,1)
Press Enter.
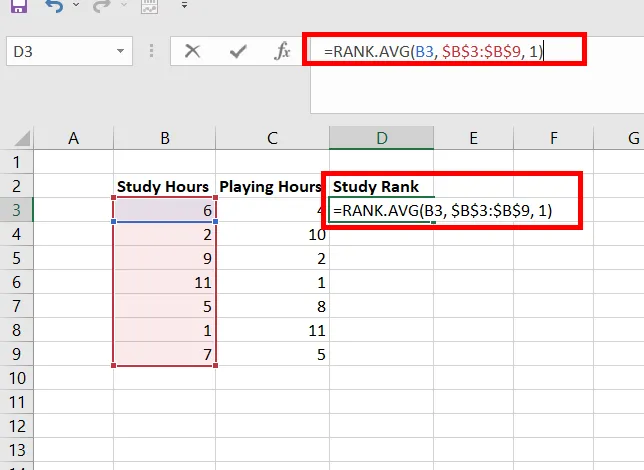
This formula calculates the rank of the study hours value in cell B3.
Step 2: Fill the Remaining Study Rank Cells
Copy the formula down from D3 to D9 to rank all study-hour values.

Step 3: Create the Play Rank Column
Add another column called Play Rank.
In cell E3, enter:
excel
=RANK.AVG(C3,$C$3:$C$9,1)
Press Enter, then copy the formula down to the remaining rows.
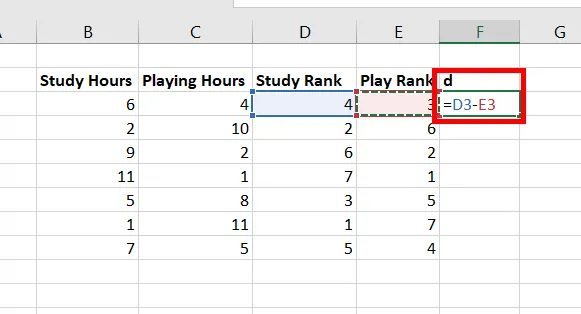
Step 4: Calculate the Rank Difference
Create a new column named d.
In cell F3, enter:
excel
=D3-E3
Press Enter and drag the formula down through all rows.
 Calculating differences between study rank and play rank values
The values in this column represent the difference between the two ranks.
Step 5: Calculate the Squared Difference
Create another column named d².
In cell G3, enter:
excel
=F3^2
Copy the formula down for all observations.
Step 6: Count the Dataset Size
Use the following formula to count the number of observations:
excel
=COUNT(C3:C9)
The result should be 7.
Step 7: Calculate the Sum of Squared Differences
Use:
excel
=SUM(G3:G9)
The total obtained is 110.
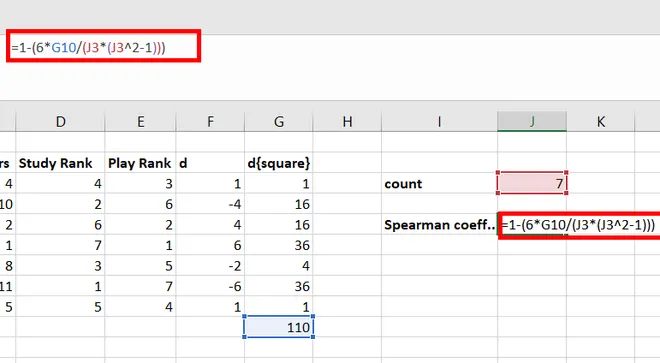
Step 8: Apply the Spearman Formula
In another cell, enter:
excel
=1-(6G10/(J3(J3^2-1)))
Press Enter.
The result is:
-0.96429
This indicates a strong negative correlation between study hours and play hours. As play time increases, study time tends to decrease.
Method 2: Calculate Spearman Correlation Using the CORREL Function
A faster alternative is to use the CORREL() function on ranked datasets.
This method avoids manually applying the Spearman formula.
 Using the CORREL function with ranked data in Excel
Step 1: Rank Both Variables
Create ranked columns for both variables using RANK.AVG() exactly as shown in Method 1.
For Study Rank:
excel
=RANK.AVG(B3,$B$3:$B$9,1)
For Play Rank:
excel
=RANK.AVG(C3,$C$3:$C$9,1)
Fill both formulas down the respective columns.
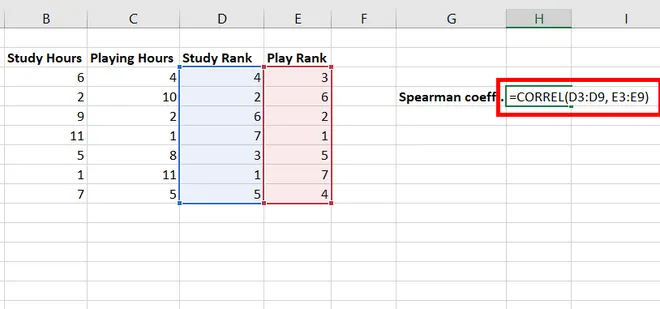
Step 2: Apply the CORREL Function
In a blank cell, enter:
excel
=CORREL(D3:D9,E3:E9)
Press Enter.
Excel returns:
-0.96429
This result matches the manually calculated Spearman Rank Correlation Coefficient, confirming a strong negative relationship between the variables.
Spearman vs Pearson Correlation in Excel
Understanding the difference between Spearman and Pearson correlation helps you choose the correct statistical method.
| Feature | Spearman Correlation | Pearson Correlation |
|---|---|---|
| Data Type | Ranked/Ordinal | Continuous |
| Relationship | Monotonic | Linear |
| Outlier Sensitivity | Low | High |
| Distribution Requirement | None | Normally distributed |
| Uses Ranks | Yes | No |
Use Spearman correlation when working with ranked data, non-linear relationships, or datasets containing significant outliers.
Best Practices for Spearman Correlation Analysis
To improve accuracy while working in Excel:
- Ensure datasets contain paired observations
- Remove missing values before calculation
- Avoid duplicate ranks when using the manual formula
- Use
CORREL()on ranked values for quicker analysis - Double-check absolute cell references using
$
You can also combine Spearman analysis with Excel charts for better data visualization and interpretation.
Conclusion
The Spearman Rank Correlation in Excel is an effective way to measure the strength and direction of relationships between variables using ranked data. Whether you use the mathematical formula or the CORREL() function, Excel provides a simple and practical environment for performing correlation analysis.
The manual method helps you understand the statistical process step by step, while the CORREL() approach offers a faster alternative for larger datasets. By mastering both techniques, you can perform more reliable statistical analysis, identify trends in data, and make better data-driven decisions in Excel.
If you regularly work with spreadsheets, statistics, or business reports, learning Spearman rank correlation is a valuable Excel skill that can improve your analytical capabilities.