Levene’s Test is a crucial statistical procedure used to assess whether two or more groups exhibit equal variances. This test is fundamental in many statistical analyses that rely on the assumption of homogeneity of variances. This guide will walk you through the process of performing Levene’s Test directly within Microsoft Excel.
Understanding the Need for Levene’s Test
Before conducting certain statistical tests, it’s essential to ensure that the variances across different groups are comparable. Levene’s Test helps confirm this assumption. For instance, in research involving comparing the effectiveness of different treatments or conditions, researchers must first verify if the variability within each group is similar.
Example Scenario: Fertilizer Impact on Plant Growth
Imagine a scenario where researchers are investigating the impact of three distinct fertilizers on plant growth. They select 30 plants, dividing them equally among the three fertilizer groups. After a month, they measure the height of each plant. The primary goal is to determine if there’s a significant difference in plant growth among the groups. However, before proceeding with a test like ANOVA, they need to ascertain if the variances in plant growth are equal across the three fertilizer groups using Levene’s Test.
Step-by-Step Implementation in Excel
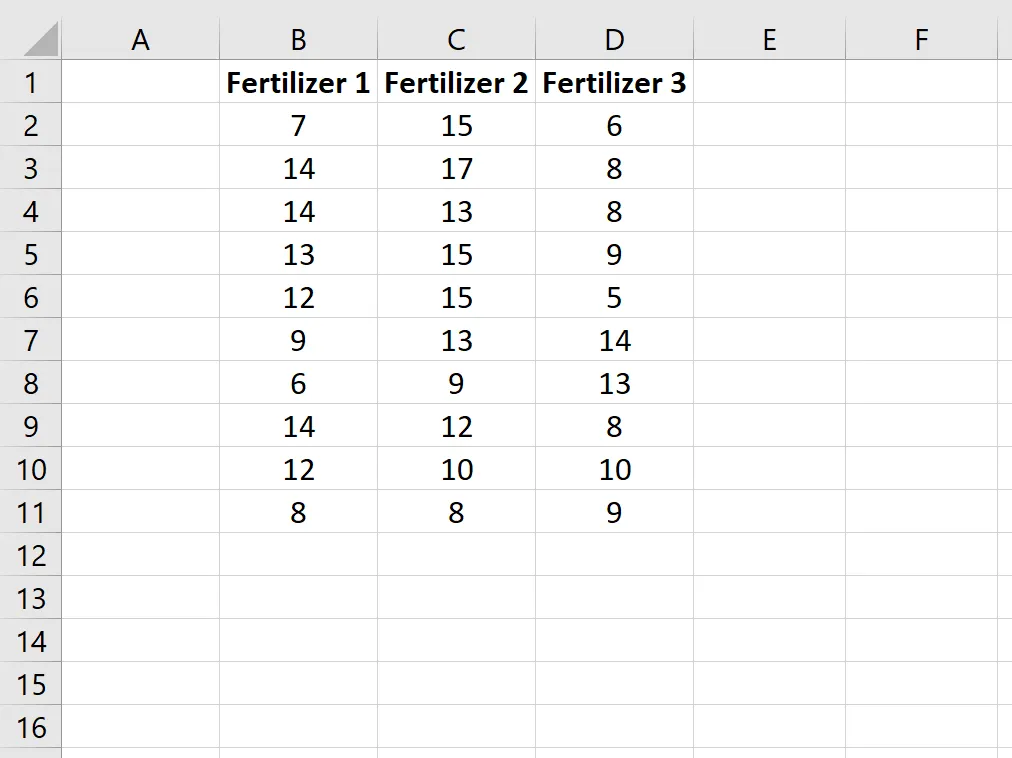
Step 1: Data Entry
Begin by inputting your data into an Excel spreadsheet. For our example, this would be the total growth (in inches) for each of the 10 plants within each of the three fertilizer groups.
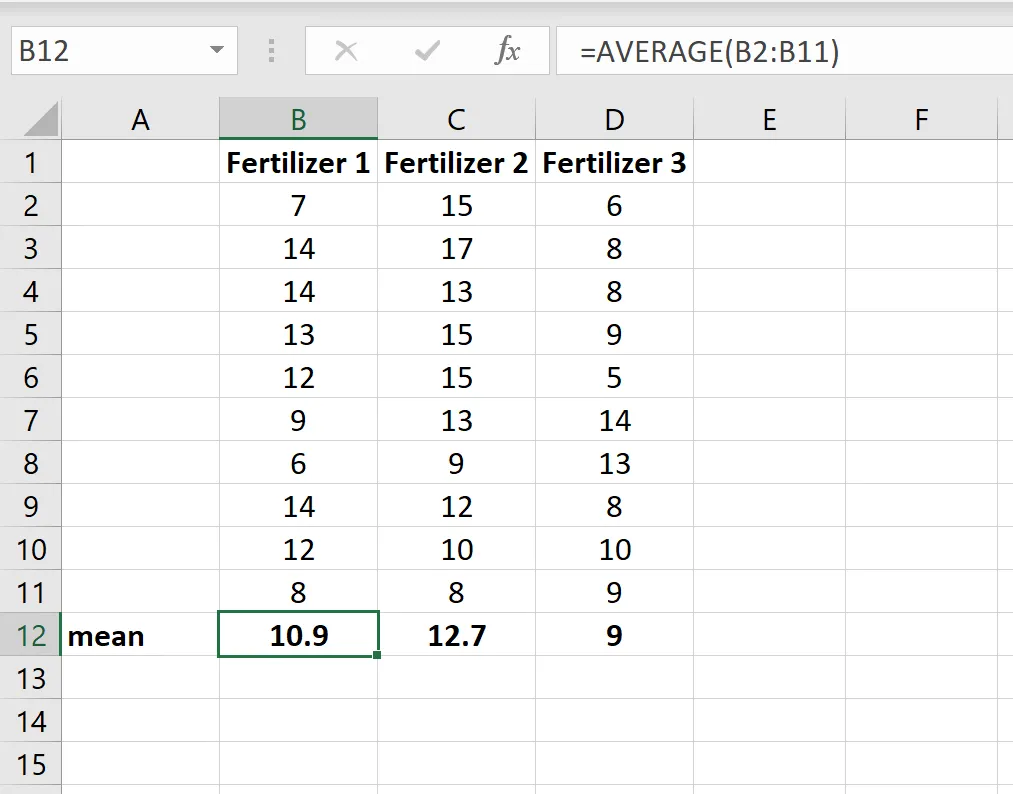
Step 2: Calculate Group Means
Next, calculate the average growth for each group. Utilize Excel’s AVERAGE() function for this. This step is crucial for determining the deviations from the mean in the subsequent steps.
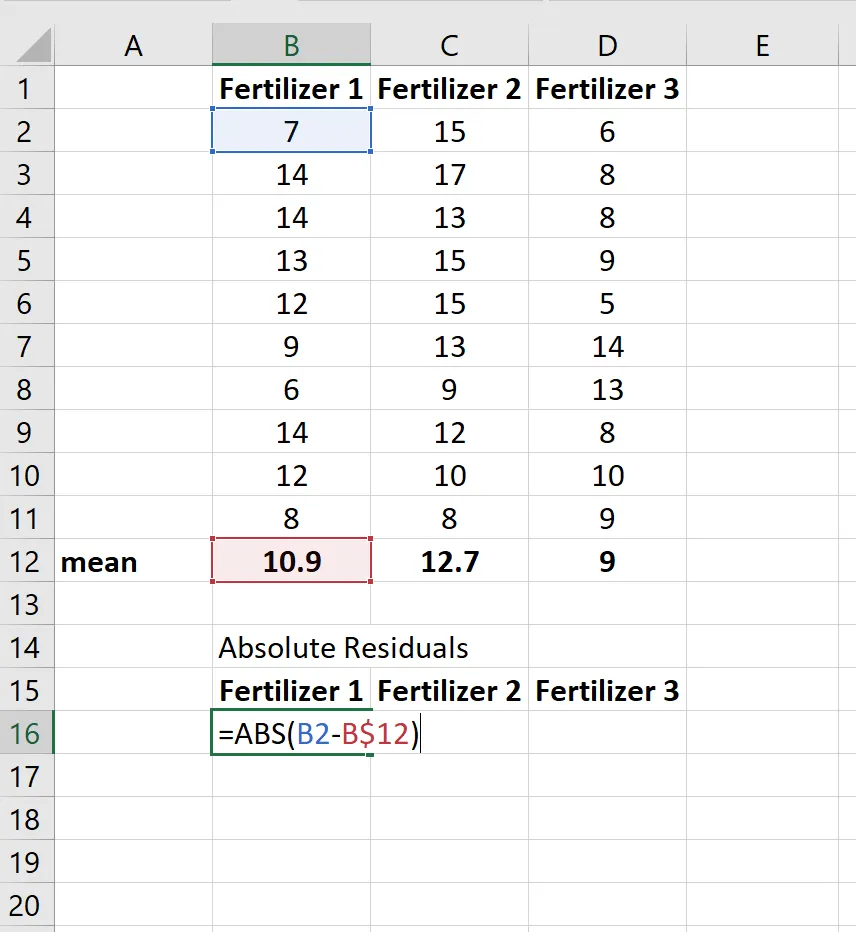
Step 3: Compute Absolute Residuals
The core of Levene’s Test involves calculating the absolute residuals for each data point. A residual is the difference between an individual data point and the mean of its group. You’ll then take the absolute value of this difference. The formula for the first observation in the first group would be ABS(data_point - group_mean). Apply this formula across all your data points.
Example formula for the first observation in Group 1: =ABS(B2-$B$11) (assuming plant growth data is in column B and the mean for Group 1 is in cell B11).
After calculating for one cell, you can drag the fill handle to copy the formula to the remaining cells, ensuring accurate calculation for all observations.
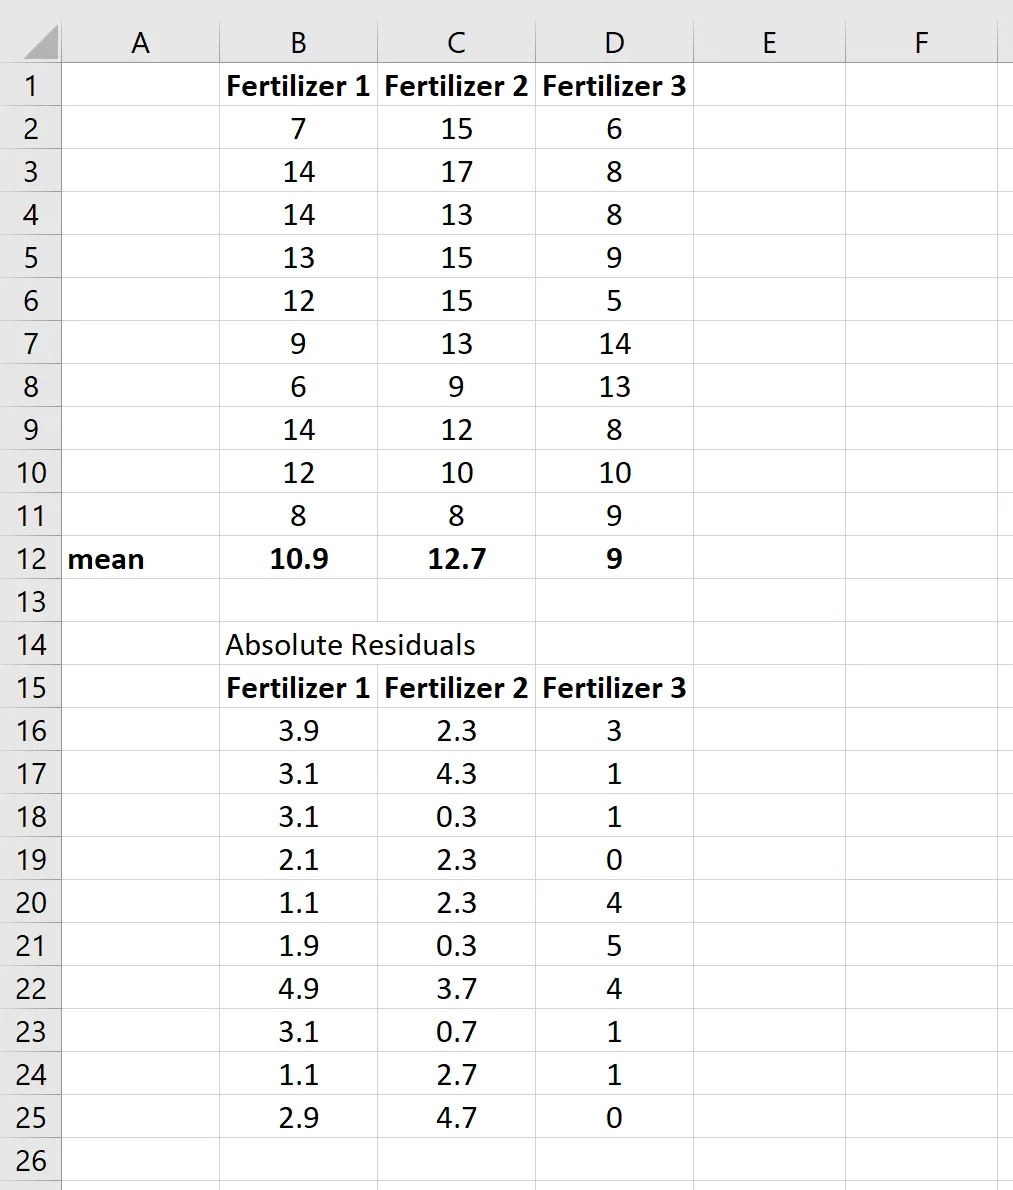 Copying Absolute Residual Formula
Step 4: Perform a One-Way ANOVA
Excel does not have a direct function for Levene’s Test. However, a common and effective workaround is to perform a One-Way ANOVA on the calculated absolute residuals. The principle is that if the variances between groups are unequal, the ANOVA will detect significant differences among the means of these absolute residuals.
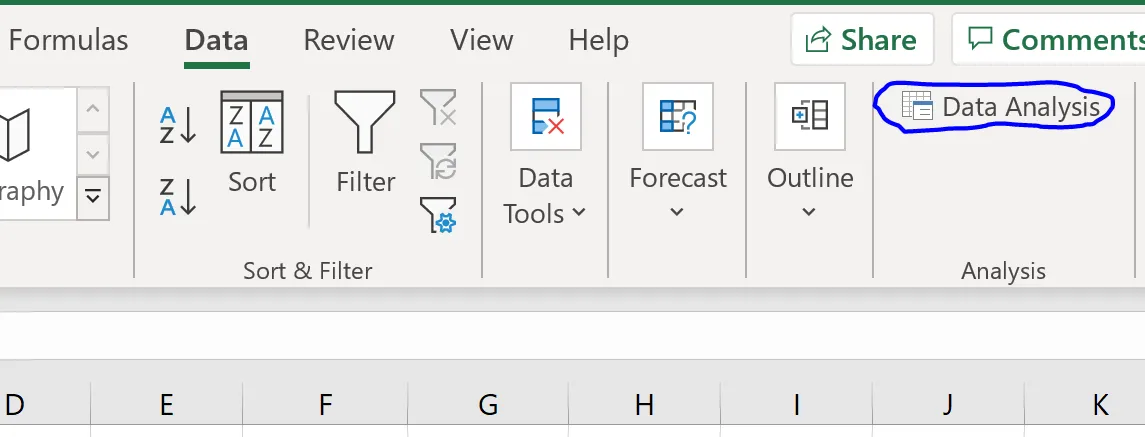
To initiate this, navigate to the Data tab in Excel. Click on Data Analysis. If the “Data Analysis” option is not visible, you will need to enable the Analysis ToolPak. This is a free add-in that can be installed via Excel’s options.
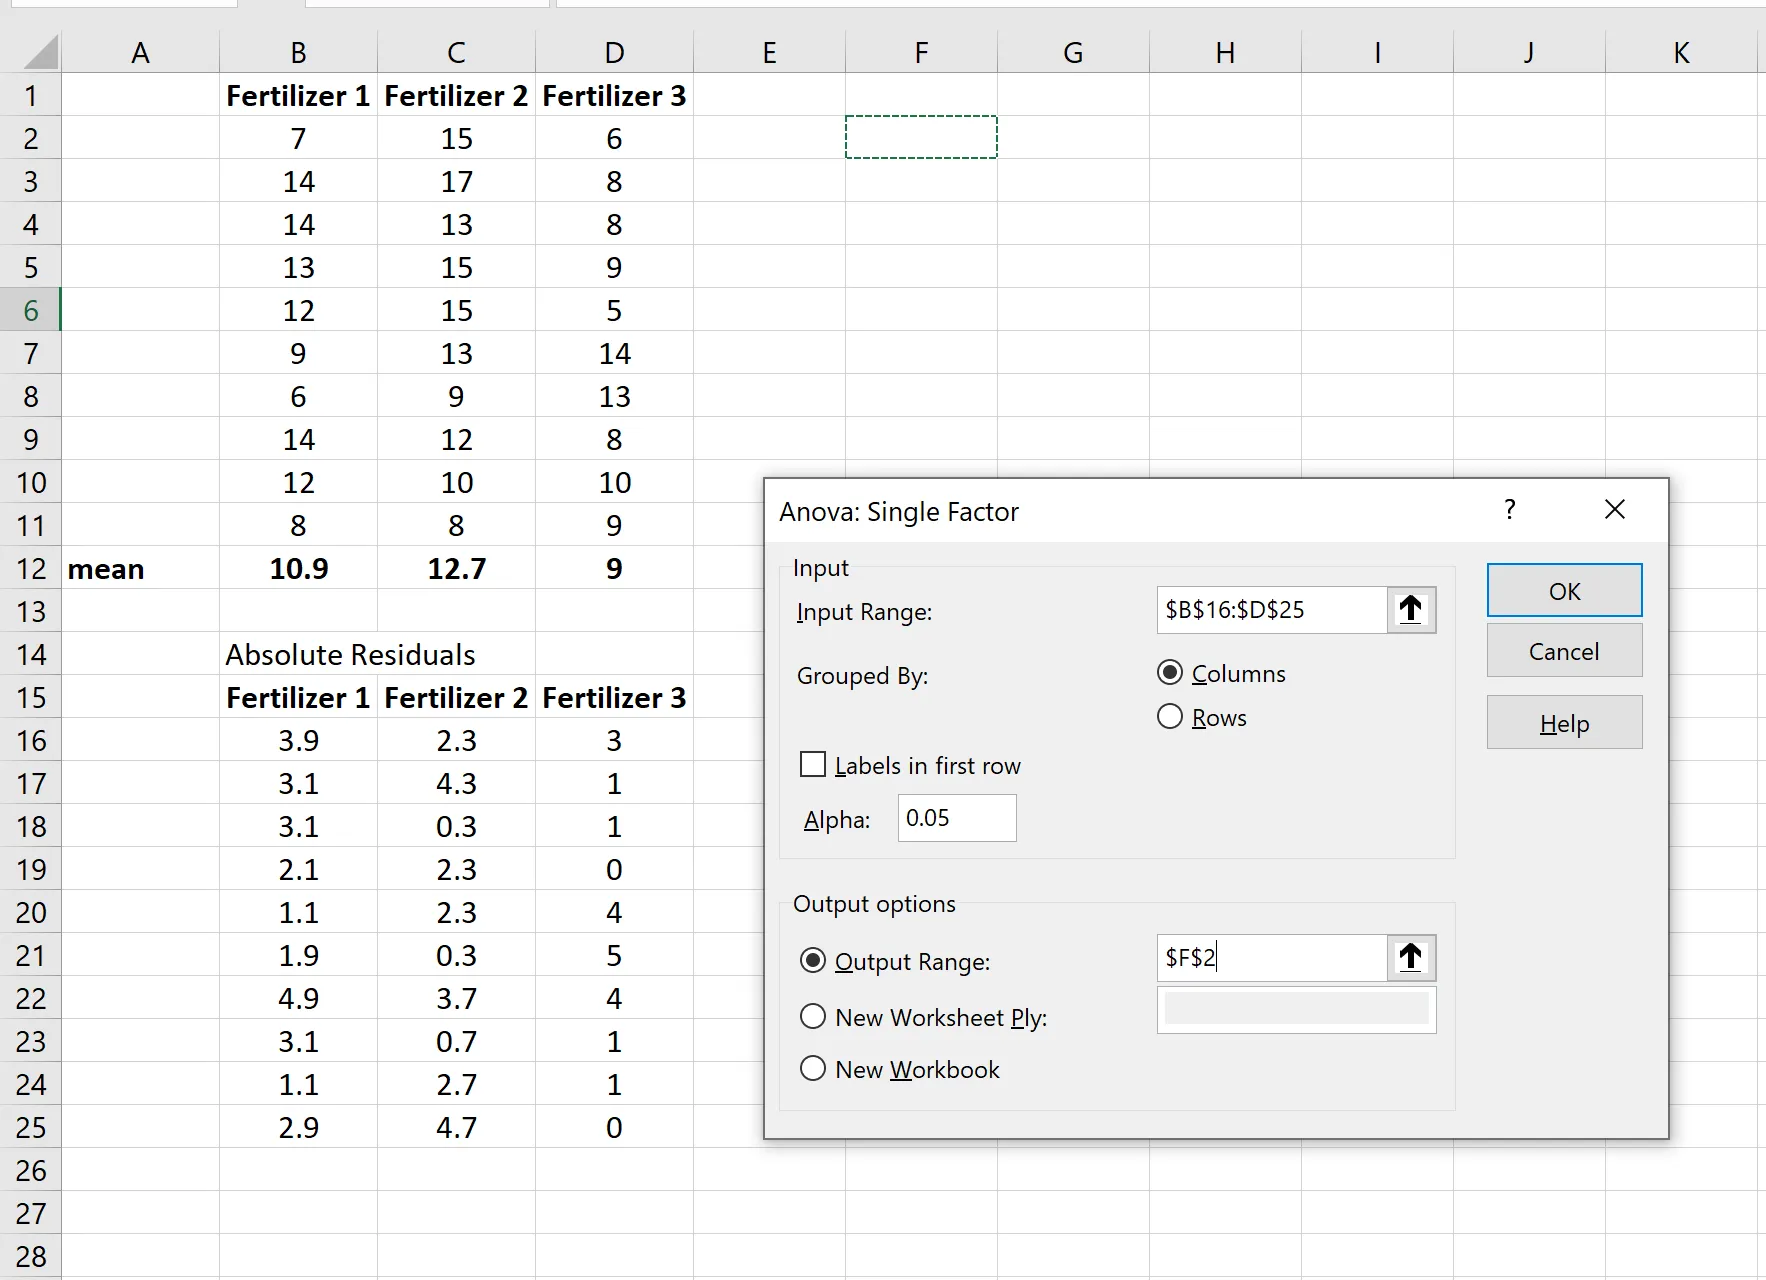
In the “Data Analysis” dialog box, select Anova: Single Factor and click OK.
Configure the ANOVA settings:
- Input Range: Select the range containing all your calculated absolute residuals.
- Output Range: Choose a cell where you want the ANOVA results to be displayed.
Click OK to run the analysis.
 Configuring Single Factor ANOVA
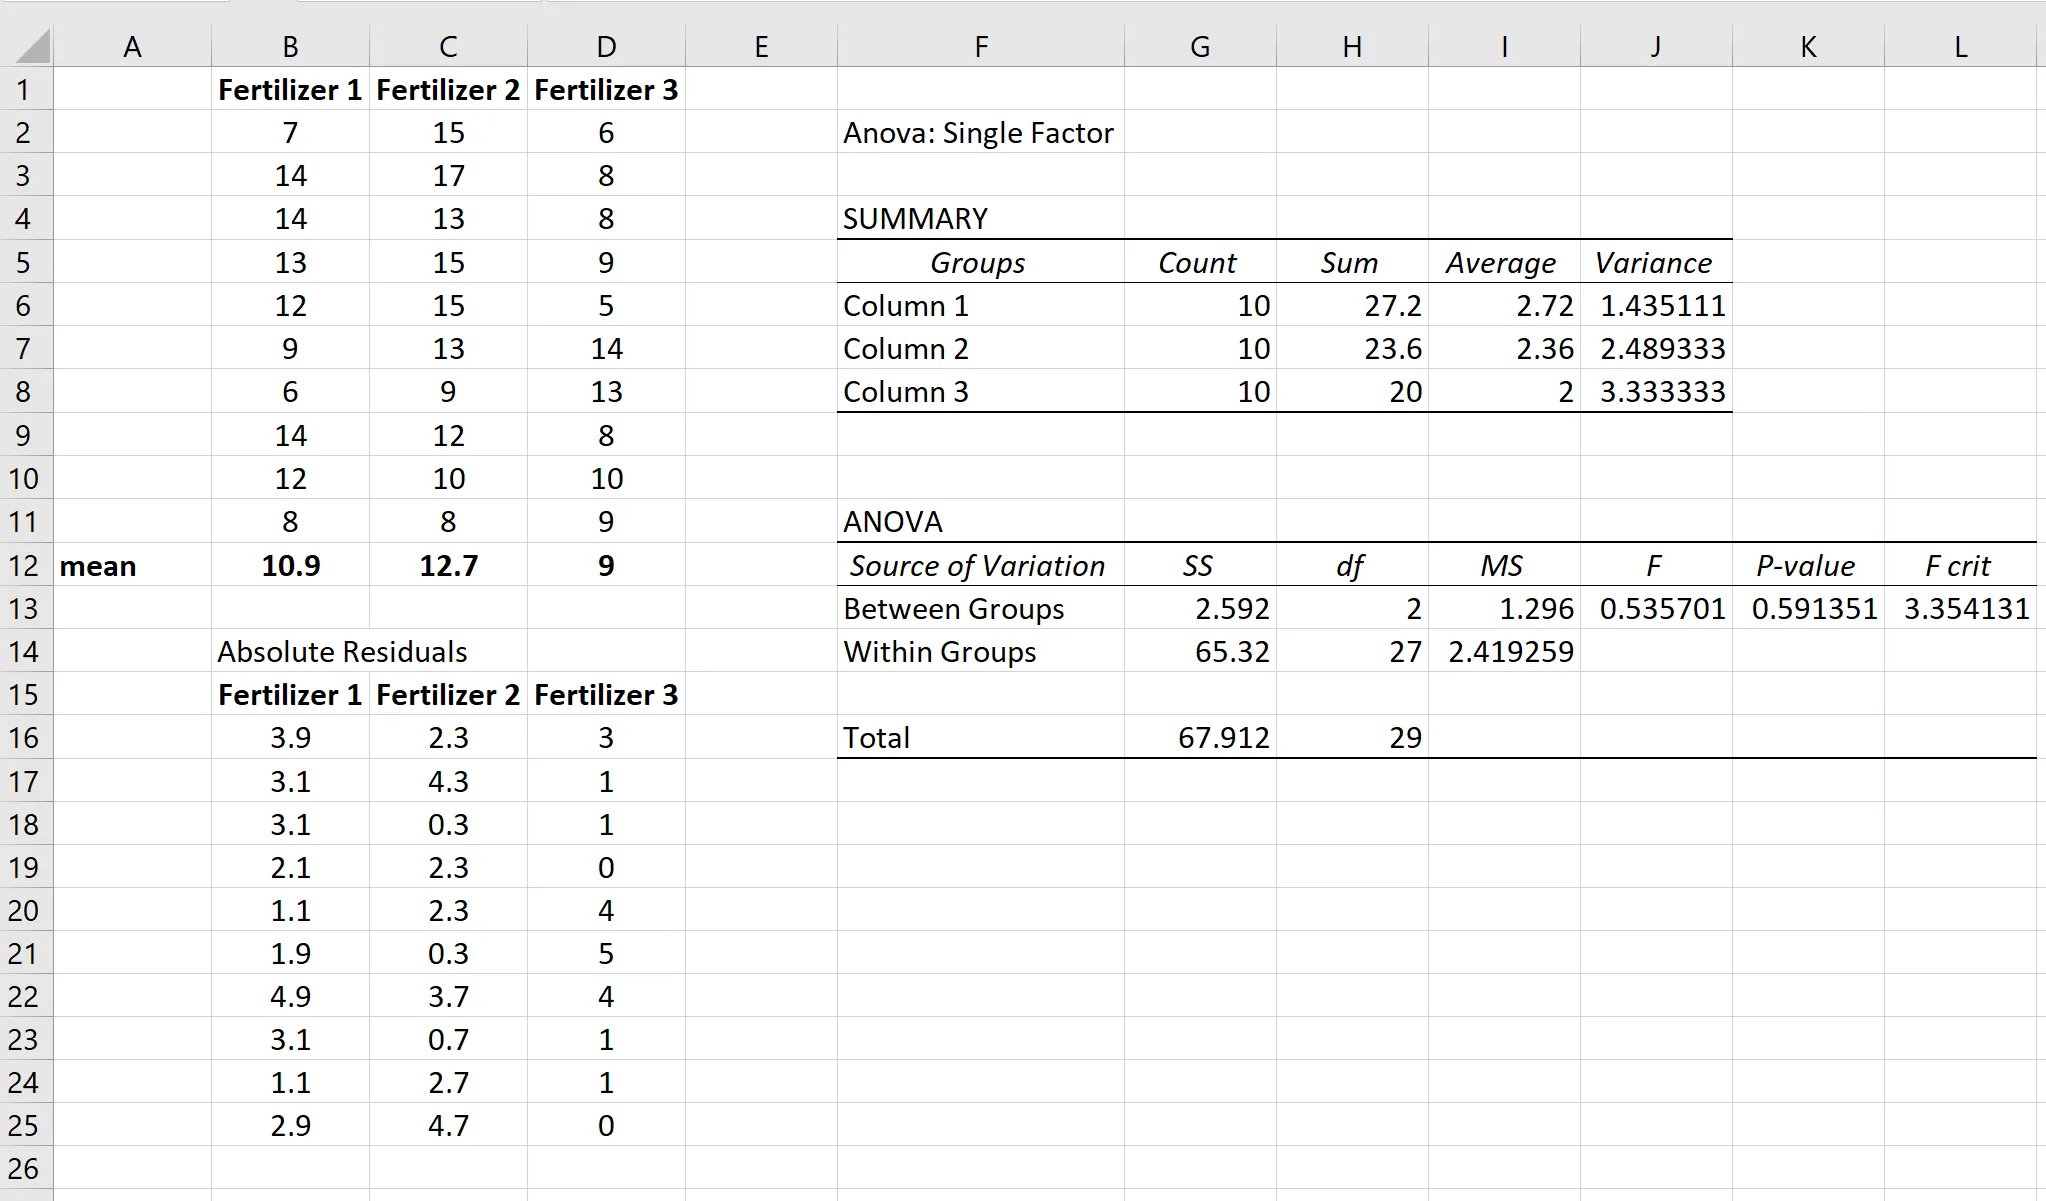
The results of the One-Way ANOVA will be generated.
Interpreting the Results
Examine the P-value generated by the One-Way ANOVA. In our example, the p-value is 0.591251.
The standard significance level (alpha) is typically set at 0.05. If the p-value from the ANOVA is greater than 0.05, you fail to reject the null hypothesis. This means there is insufficient statistical evidence to conclude that the variances among the three groups are different. Consequently, the assumption of equal variances for subsequent tests like ANOVA is met.
Conversely, if the p-value were less than 0.05, you would reject the null hypothesis, indicating that the group variances are significantly different.
By following these steps, you can effectively perform Levene’s Test in Excel to validate the assumption of equal variances, ensuring the reliability of your subsequent statistical analyses.