The Analysis of Variance (ANOVA) is a powerful statistical tool that helps determine if there are significant differences between the means of three or more independent groups. Understanding and applying ANOVA is crucial for various analytical tasks, particularly within methodologies like Six Sigma. This guide will walk you through the fundamental concepts of ANOVA and demonstrate how to perform one-way and two-way ANOVA tests using Microsoft Excel’s Data Analysis Toolpak.
What is ANOVA?
ANOVA, an inferential statistical analysis, is used to ascertain whether observed differences between groups are likely due to a specific factor or simply random chance. It operates by partitioning the total variation in the data into different sources, allowing us to compare the variation between groups to the variation within groups. Factors are the independent variables used to categorize the outcome variable (dependent variable) into distinct groups.
ANOVA is an inferential statistical analysis.
This means we use a sample of measurements to make educated inferences about a larger population. For instance, when testing the peel strength of tape from different suppliers, the suppliers represent the factor, and the peel strength measurements for each supplier constitute a group.
What Does ANOVA Do?
ANOVA’s primary function is to test the null hypothesis, which, in the case of one-way ANOVA, states that the means of all groups are equal. It achieves this by calculating an F-statistic, which is the ratio of the variance between groups to the variance within groups. A larger F-statistic suggests that the variation between groups is greater than the variation within groups, potentially indicating a significant difference between group means.
A key output of ANOVA is the p-value, which indicates the probability of observing the data (or more extreme data) if the null hypothesis were true. A small p-value (typically less than 0.05) leads to the rejection of the null hypothesis, suggesting that at least one group mean is significantly different from the others.
To learn more, check out this glossary of Lean Six Sigma terms.
Let’s explore how to implement one-way ANOVA in Excel, focusing on the effect of a single factor.
The Data Analysis Toolpak in Excel
Microsoft Excel offers a robust add-in called the Data Analysis Toolpak, which provides various statistical and analytical tools, including ANOVA. To enable it:
- Navigate to File > Options.
- In the Excel Options window, select Add-ins.
- Next to Manage, choose Excel Add-ins and click Go.
- Check the box for Analysis ToolPak and click OK.
A new Data Analysis button will appear on your Data ribbon.
Example of One-Way ANOVA in Excel’s Data Analysis Toolpak
One-way ANOVA is suitable when comparing means across three or more groups defined by a single factor. Consider an example where you want to compare the peel strength of tapes from different suppliers using your automatic taping machine.
Data Arrangement for One-Way ANOVA in Excel
Excel accommodates data arranged in either rows or columns for one-way ANOVA. However, organizing data in columns is generally recommended for consistency with other Data Analysis Toolpak features and statistical software.
Download your data files
Follow along with the steps in the article by downloading these practice files
How to Use One-Way ANOVA in Excel
- Click the Data tab on the ribbon.
- Click Data Analysis.
- Select Anova: Single Factor and click OK.
- For Input Range, select your data, including headers if applicable. Ensure that data for each group is in a separate column.
- Choose an Output Options location.
- Click OK to run the analysis.
The results will display summary statistics for each group, including the mean and variance, followed by the ANOVA hypothesis test results, most notably the p-value. A p-value greater than 0.05 in this scenario suggests that there isn’t statistically significant evidence to conclude that the tape suppliers have different peel strengths when used with your machine.
What If You Have More Factors?
When your analysis involves more than one factor, such as both tape supplier and box type, two-way ANOVA becomes necessary. This allows you to examine the individual effects of each factor and their potential interaction effect on the outcome variable.
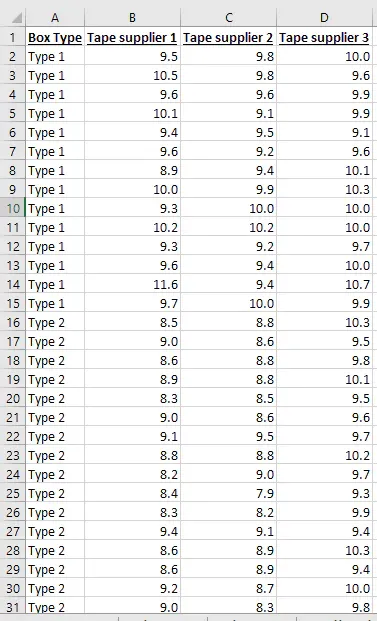
Data Arrangement for Two-Way ANOVA in Excel
Excel requires a specific data arrangement for two-way ANOVA with replication:
- Data for one factor should be in separate columns.
- Data for the second factor should be in consecutive rows.
- Each group must have the same number of measurements (replication).
This structure is often referred to as a two-way table.
Download your data files
Follow along with the steps in the article by downloading these practice files
How to Use Two-Way ANOVA in Excel
- Click the Data tab.
- Click Data Analysis.
- Select Anova: Two Factor with Replication and click OK.
- For Input Range, select your data, ensuring it includes headers.
- In Rows per sample, enter the number of measurements for each group (which must be consistent across all groups).
- Choose an Output Options location.
- Click OK to generate the results.
The output will include summary statistics for each combination of factors and hypothesis tests for the main effects of each factor and their interaction. A small p-value for the interaction term indicates that the effect of one factor depends on the level of the other factor, suggesting a complex relationship that cannot be explained by the individual effects alone.
Bonus Tutorial: Selecting Which Hypothesis Test to Use
Choosing the appropriate hypothesis test is critical for valid statistical analysis. Factors such as the type of data, the number of groups, and the research question will guide this selection. For instance, if you are comparing means of two groups, a t-test might be more appropriate than an ANOVA.
Free lesson from GoSkills Hypothesis Testing course by Ray Sheen, LSS BB
Conclusion
ANOVA, particularly when performed in Excel using the Data Analysis Toolpak, is an invaluable technique for comparing group means and understanding the influence of various factors on an outcome. Whether conducting a simple one-way ANOVA or a more complex two-way ANOVA, careful attention to data arrangement and interpretation of results is essential. By mastering these tools, you can transform data into actionable insights, leading to more informed decisions and improved processes.
You can learn more advanced techniques for analyzing ANOVA data in this course on hypothesis testing. If you’ve already acquired the basics, then you’re ready to proceed to more advanced considerations in this design of experiments course. Either way, the knowledge that you gain will help you prepare to ensure that your projects exceed your expectations.
[Transform data into actionStop guessing, start analyzing! Get skilled-up with our data analysis courses.
Start free trial
](https://www.goskills.com/Data-Analysis/Courses?source=blog-cta&blogId=270)
Cody Steele
Cody is a technical communicator and statistician who wants to help people collect the right data and analyze it to make informed decisions. His specialities include statistics, technical communication, statistical reliability, JMP, SAS, and writing for translation.