If you’ve ever worked with APIs or web applications, you’ve likely encountered JSON files and wondered how to get that data into a spreadsheet. Learning how to convert a JSON file to Excel is one of the most practical skills for anyone who regularly handles data — it bridges the gap between developer-friendly formats and the powerful analysis tools Excel provides. Whether you’re a data analyst, business user, or developer, this guide walks you through every method available, from built-in Excel features to Python scripting.
Quick Process Overview
Before diving into the details, here’s the end-to-end workflow at a glance:
- Prepare your JSON file — Validate the structure and data format.
- Choose a conversion method — Desktop software, online tool, or Python script.
- Import the file — Upload or read it through code.
- Configure field mapping — Select which fields you want in the spreadsheet.
- Run the conversion — Export as .xlsx or .csv.
- Review and clean up — Open the file in Excel and reformat as needed.
Why Convert JSON to Excel?
JSON (JavaScript Object Notation) is the dominant format for APIs and web services because it’s lightweight and human-readable for developers. Excel, on the other hand, is the go-to tool for business users who need to filter, sort, chart, and share structured data. Converting between the two unlocks the best of both worlds:
- Easier manipulation: Apply Excel’s filtering, sorting, and formula capabilities directly to your data.
- Broader accessibility: Spreadsheet files are universally understood across teams and departments.
- Deeper analysis: Combine your data with PivotTables and Power Query to surface insights from complex datasets.
For example, if you’re pulling sales data from an e-commerce API in JSON format, converting it to Excel lets your finance team work with it immediately — no coding knowledge required on their end.
Common Methods for Converting JSON to Excel
Method 1: Desktop Software
Microsoft Power Query (built into Excel) is the most seamless option for Windows users. It imports JSON directly, auto-detects the structure, and outputs a formatted table — no third-party tools needed.
Altova MapForce is a professional-grade tool designed for complex data mapping between JSON, XML, Excel, and databases. It’s ideal for enterprise environments with strict schema requirements.
JSON to CSV Converter apps (many are free) take a two-step approach: convert JSON to CSV first, then open the CSV in Excel. This works well for flat, simple JSON structures.
Method 2: Online Conversion Tools
If you don’t want to install software, several web-based tools handle the conversion instantly:
- ConvertCSV.com: Upload your JSON file, select “JSON to Excel,” and download the resulting .xlsx file in seconds.
- JSON2XLS.com: Clean interface with support for batch conversions — useful when you have multiple files.
- Aconvert.com: Offers column formatting options before you export, giving you more control over the output structure.
These tools are best for one-off conversions involving non-sensitive data. Avoid uploading confidential business information to third-party websites.
Method 3: Python Scripting
For recurring tasks or large datasets, writing a Python script gives you full flexibility and automation potential. The pandas library makes JSON-to-Excel conversion remarkably straightforward:
import json
import pandas as pd

# Step 1: Read the JSON file
with open('data.json', 'r', encoding='utf-8') as f:
    data = json.load(f)

# Step 2: Normalize and convert to DataFrame
df = pd.json_normalize(data)

# Step 3: Save as Excel
df.to_excel('data.xlsx', index=False)Prerequisites: Install the required libraries before running the script:
pip install pandas openpyxlThis approach scales well — you can process millions of rows, handle nested JSON structures, and schedule the script to run automatically using Task Scheduler (Windows) or cron (Linux/macOS).
Step-by-Step Guide: Using Power Query in Excel 2016 and Later
Power Query is the recommended method for most Excel users. Here’s a detailed walkthrough.
Step 1: Open the JSON Import Dialog
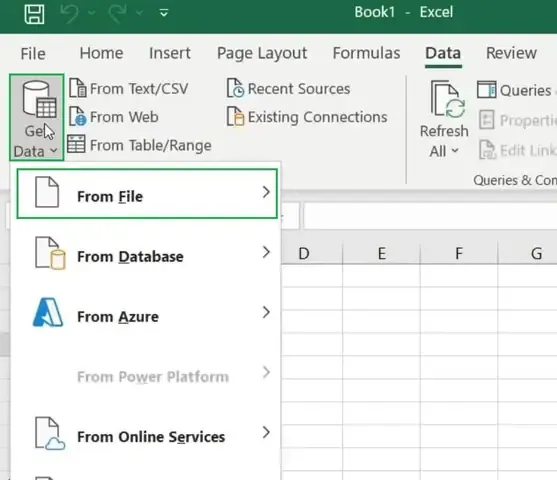
Launch Excel and navigate to the Data tab. Click Get Data → From File → From JSON. Browse to your JSON file and click Import.
Step 2: Expand the JSON Structure in Power Query Editor
Power Query opens a preview showing a single column labeled Record or List. Click the Expand icon (the double-arrow button in the column header) to unfold the nested fields into individual columns.
For deeply nested JSON (objects within objects), you may need to repeat the expand step multiple times until all fields are flattened into separate columns.
Step 3: Clean and Filter the Data
Once the data is expanded, you can refine it directly in Power Query:
- Remove unwanted columns: Right-click any column header → Remove.
- Rename columns: Double-click the header to give it a clearer label.
- Change data types: Click the type icon (ABC for text, 123 for numbers) and select the correct type — for instance, setting a date string to Date format.
Step 4: Load the Data into Excel
When you’re satisfied with the structure, click Close & Load in the top-left corner. Excel creates a new worksheet containing your data as a formatted table, ready for further analysis.
Working with Your Data After Conversion
Validating the Data
Before doing any analysis, take a few minutes to audit the imported data:
- Check for blank cells: Use Filter → Blanks on each column to spot missing values.
- Standardize date formats: Inconsistent date formatting (e.g., mixing MM/DD/YYYY and DD/MM/YYYY) causes calculation errors. Set a uniform format via Format Cells → Date.
- Verify numeric fields: Make sure phone numbers, IDs, and ZIP codes haven’t been converted to numbers — they should remain as text.
Building PivotTables for Quick Reports
PivotTables are one of the most powerful reasons to get your JSON data into Excel. To create one:
- Click anywhere inside your data table.
- Go to Insert → PivotTable.
- Drag fields into the Rows, Columns, and Values areas to build your report.
For example, if you’ve imported API data containing orders by region and product category, a PivotTable can summarize total revenue by region in under a minute.
Creating Charts for Visualization
Select your data range, then go to Insert → Chart and choose the chart type that best represents your data — bar charts for comparisons, line charts for trends, pie charts for proportions. Excel’s chart tools make it easy to turn raw JSON-sourced data into presentation-ready visuals.
Common Errors and How to Fix Them
| Error | Cause | Fix |
|---|---|---|
| Invalid JSON error | Extra or missing brackets, commas, or quotes | Paste your JSON into jsonlint.com to identify and fix syntax errors. |
| Missing columns after import | Nested JSON objects not fully expanded | Use pd.json_normalize() with the record_path parameter in Python, or repeat the Expand step in Power Query. |
| Wrong data types | Excel auto-converts values (e.g., phone numbers become integers) | Manually set column types in Power Query before loading, or format cells after import. |
| File too large for Excel | Excel has a row limit of approximately 1,048,576 rows | Split your JSON file into smaller chunks, or use Python with chunked processing (chunksize in pandas). |
Best Practices for JSON-to-Excel Workflows
Developing good habits around this process will save you hours of troubleshooting:
- Always keep the original JSON file intact. Work on a copy so you can re-run the conversion if something goes wrong.
- Validate against the schema first. If the API you’re working with provides a schema document (OpenAPI/Swagger), use it to understand which fields are available before mapping them.
- Use a recent version of Excel. Power Query has improved significantly in Excel 2019, Microsoft 365, and Excel for Mac. Older versions may lack some features.
- Automate repetitive tasks. If you’re converting the same JSON structure on a regular schedule, a Python script with scheduled execution is far more efficient than manual steps.
- Document your transformation steps. Power Query stores each step you apply; add descriptive names so teammates (or future you) can understand the logic.
Reference Resources
- Microsoft Docs – Get data from JSON: Official documentation for the Power Query JSON connector.
- Pandas Documentation – json_normalize: Full reference for flattening nested JSON with Python.
- JSONLint: Free online validator for diagnosing JSON syntax errors.
Conclusion
Converting a JSON file to Excel is a straightforward process once you know which tool fits your situation. Power Query is the best choice for most Excel users who need a visual, no-code interface. Online converters are ideal for quick, one-time tasks. Python scripting is the right path when you’re dealing with large volumes of data or need to automate the workflow. By following the steps outlined above — preparing your file, choosing the right method, cleaning the output, and validating the result — you’ll consistently produce clean, analysis-ready spreadsheets. Start with the method that matches your current skill level, and consider moving to Python scripting as your data volumes grow. Your team will thank you for the well-structured Excel reports.