In the realm of process improvement, the DMAIC (Define, Measure, Analyze, Improve, Control) and DFSS (Design for Six Sigma) methodologies provide robust frameworks for achieving operational excellence. SigmaXL, a powerful toolset, offers a suite of templates designed to streamline these methodologies, making complex projects more manageable and effective. This guide explores these essential templates, empowering users to drive significant improvements in their processes.
Essential DMAIC & DFSS Templates in SigmaXL
SigmaXL provides intuitive access to these critical templates through its user-friendly interface. To locate them, navigate to SigmaXL > Templates & Calculators > DMAIC & DFSS Templates.
Team/Project Charter
The Team/Project Charter template is foundational for any improvement initiative. It clearly defines the project’s scope, objectives, team members, and key stakeholders. This ensures everyone involved is aligned from the outset, preventing scope creep and fostering clear communication.
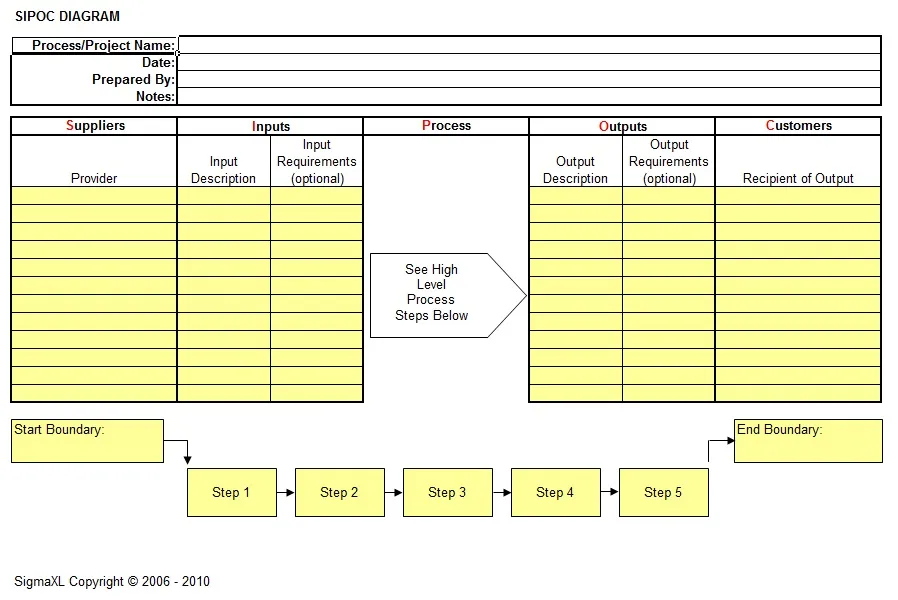
SIPOC Diagram
A SIPOC (Suppliers, Inputs, Process, Outputs, Customers) Diagram offers a high-level overview of a process. It helps identify all relevant elements within a process, from suppliers and their inputs to the process steps, outputs, and ultimately, the customer. This template is invaluable for understanding the context of a problem and identifying potential areas for improvement.
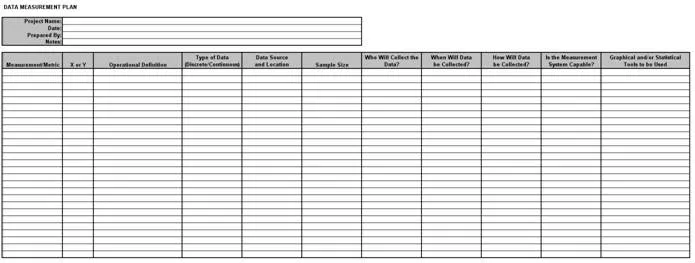
Data Measurement Plan
Effective data collection is crucial for successful process improvement. The Data Measurement Plan template guides users in defining what data needs to be collected, how it will be measured, and by whom. This ensures that the data gathered is relevant, accurate, and sufficient for analysis, forming the basis for informed decision-making.
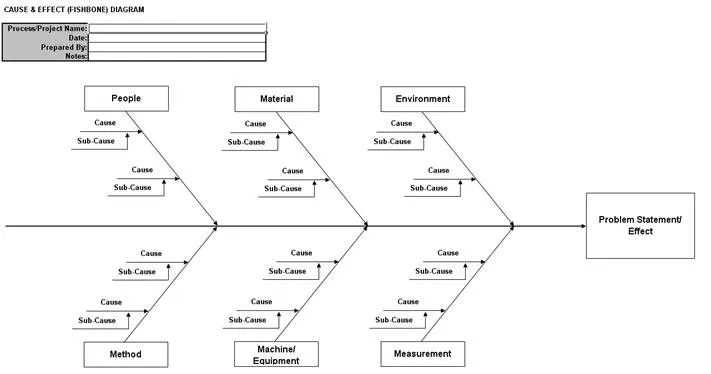
Cause & Effect (Fishbone) Diagrams
The Cause & Effect (Fishbone) Diagram, also known as a Ishikawa diagram, is a powerful tool for root cause analysis. It visually organizes potential causes of a problem into different categories (e.g., People, Process, Technology, Environment). This structured approach helps teams brainstorm and identify the underlying causes rather than just addressing symptoms. SigmaXL offers both a basic diagram template and a more comprehensive template for detailed analysis.
Notes on using the Cause & Effect Diagram:
- Overwrite text in the Cause, Sub-Cause, and Problem Statement/Effect sections to accurately reflect your project.
- Copy and paste to create additional causes or sub-causes as needed.
- Ungroup grouped arrows using Excel’s Draw > Ungroup tool if you need to manipulate them individually.
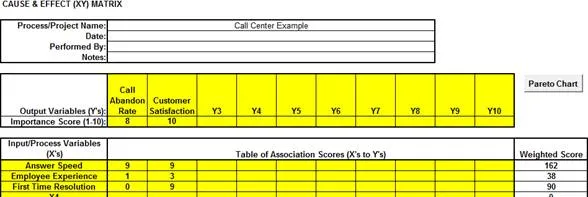
Cause & Effect (XY) Matrix
The Cause & Effect (XY) Matrix template is particularly useful for prioritizing input variables (X’s) based on their impact on output variables (Y’s). This involves weighting outputs based on customer importance and then assigning association scores between X’s and Y’s. This allows for a data-driven approach to identifying the most influential factors.
Notes for the Cause & Effect (XY) Matrix:
- Weight Output Variables (Y’s): Use a scale of 1 to 10, where 10 signifies the highest importance to the customer.
- Root Cause Analysis: Assign association/effect multiplier scores for each X to Y on a scale of 0, 1, 3, 9 (0=None, 1=Weak, 3=Moderate, 9=Strong). Initially, this may be a subjective team assessment. Validate these associations with graphical and statistical tools by collecting data.
- Project or Solution Selection: Assign association multiplier scores for each X to Y using a scale of 1 to 10, with 10 indicating a strong association.
After completing the matrix, click the Pareto Chart button to visualize the weighted scores by input/process variables.
 XY Matrix
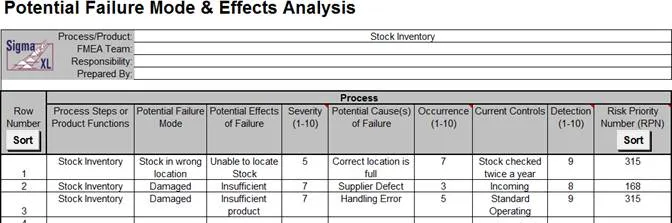
Failure Mode & Effects Analysis (FMEA)
The Failure Mode & Effects Analysis (FMEA) template is a proactive risk assessment tool. It helps identify potential failure modes within a process or product, assess their potential effects, and determine the severity, occurrence, and detection likelihood. This enables teams to prioritize risks and implement preventive actions. SigmaXL allows sorting by Risk Priority Number (RPN) and Revised RPN to focus on the highest risks.
When using the FMEA template:
- Hovering over the Severity, Occurrence, or Detection headings will display recommended scales.
- Click Risk Priority Number (RPN) Sort to order rows by RPN in descending order.
- Click Revised Risk Priority Number Sort to sort by Revised RPN.
- Click Row Number Sort to return the worksheet to its original order.
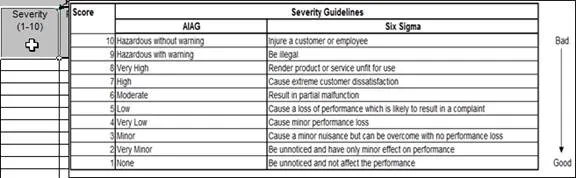 FMEA Scales
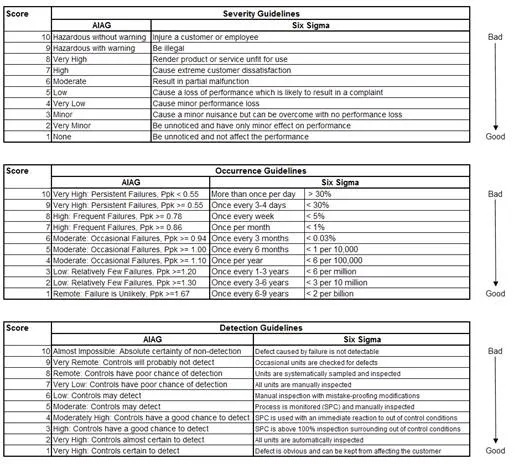 FMEA Scales Continued
Quality Function Deployment (QFD)
Quality Function Deployment (QFD), often referred to as the “House of Quality,” translates customer requirements into specific design and process characteristics. The SigmaXL QFD template (available in various sizes like 10×10, 20×20, 30×30) helps teams prioritize features and ensure that development efforts are focused on meeting customer needs effectively.
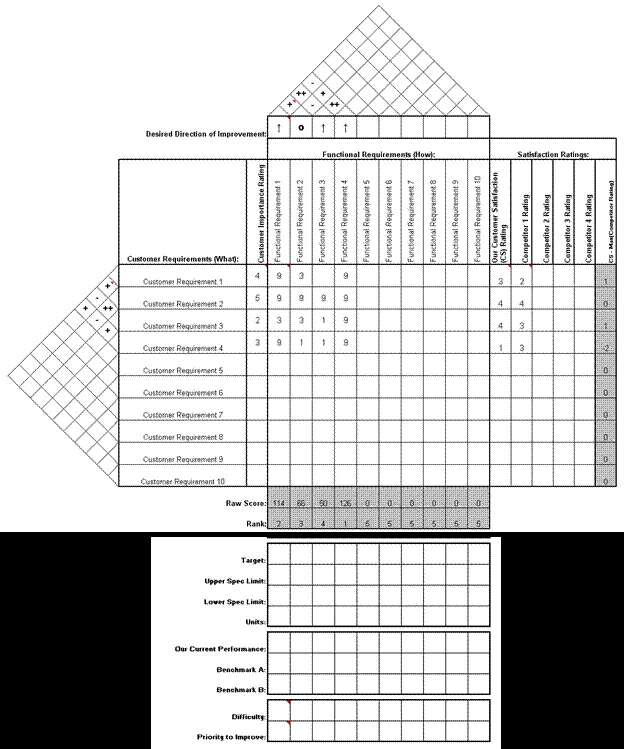 QFD Example
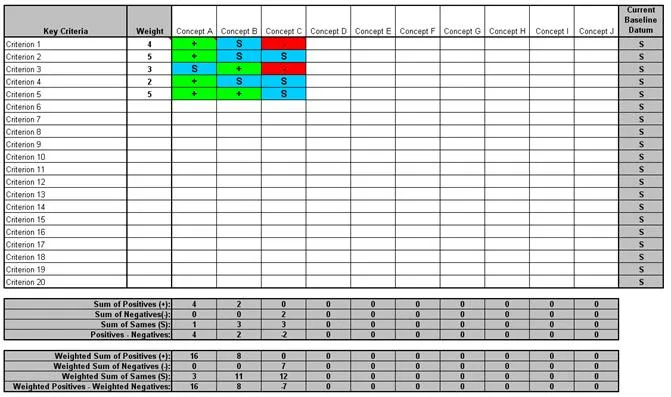
Pugh Concept Selection Matrix
The Pugh Concept Selection Matrix is used for evaluating and selecting product or process concepts. It compares different concepts against a baseline or “datum” based on predefined criteria. This systematic approach facilitates objective decision-making when choosing the best concept to move forward with.
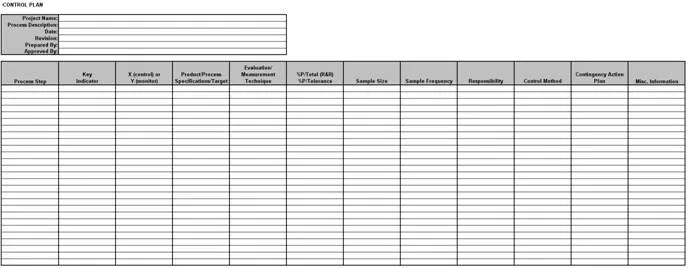
Control Plan
Finally, the Control Plan template is essential for sustaining improvements. It outlines the methods and systems for monitoring a process after improvements have been implemented, ensuring that the gains are maintained over time. This includes defining control measures, frequencies, and responsibilities.
 Control Plan
By leveraging these comprehensive templates within SigmaXL, organizations can effectively implement DMAIC and DFSS methodologies, leading to data-driven decision-making, reduced variability, and sustained process improvements. These tools are instrumental in fostering a culture of continuous improvement and achieving Six Sigma goals.