The Pearson correlation coefficient is a powerful statistical tool used to quantify the linear relationship between two variables. It yields a value ranging from -1 to 1, where -1 signifies a perfect negative linear correlation, 0 indicates no linear correlation, and 1 represents a perfect positive linear correlation. To ascertain the statistical significance of this coefficient, a correlation test is performed, involving the calculation of a t-score and its associated p-value.
The formula for calculating the t-score is:
t = r√(n-2) / (1-r²)
Here, ‘r’ represents the correlation coefficient, and ‘n’ denotes the sample size. The p-value is then determined as the corresponding two-sided p-value for the t-distribution with n-2 degrees of freedom. This guide will walk you through performing a correlation test step-by-step in Microsoft Excel.
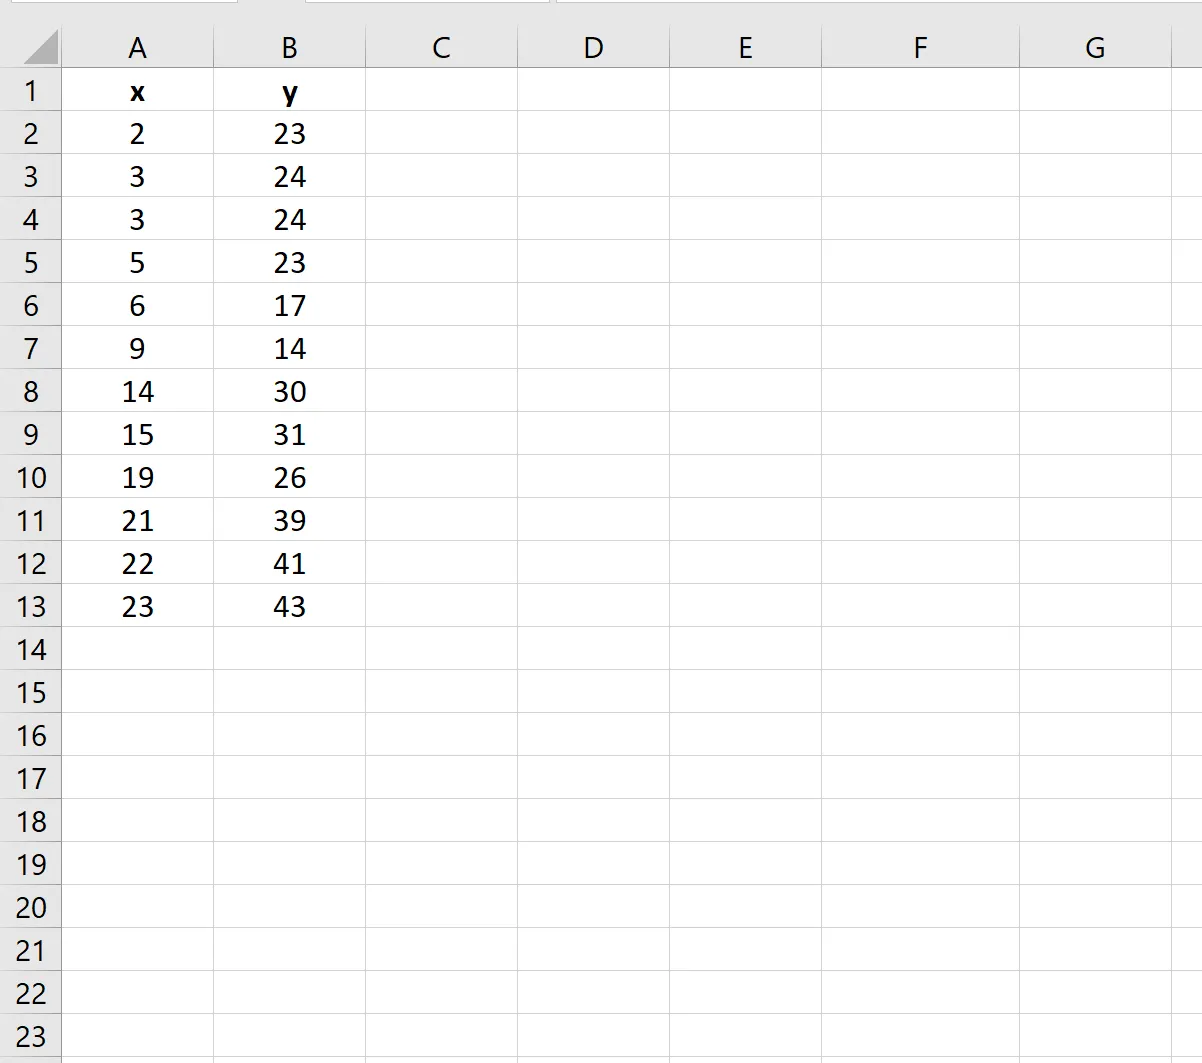
Step 1: Data Entry
Begin by entering your data for the two variables into an Excel spreadsheet. For instance, you might have data points for ‘Variable A’ and ‘Variable B’ in adjacent columns.
Step 2: Calculate the Correlation Coefficient
Utilize Excel’s built-in CORREL() function to compute the correlation coefficient between your two variables. This function requires you to specify the data ranges for both variables.
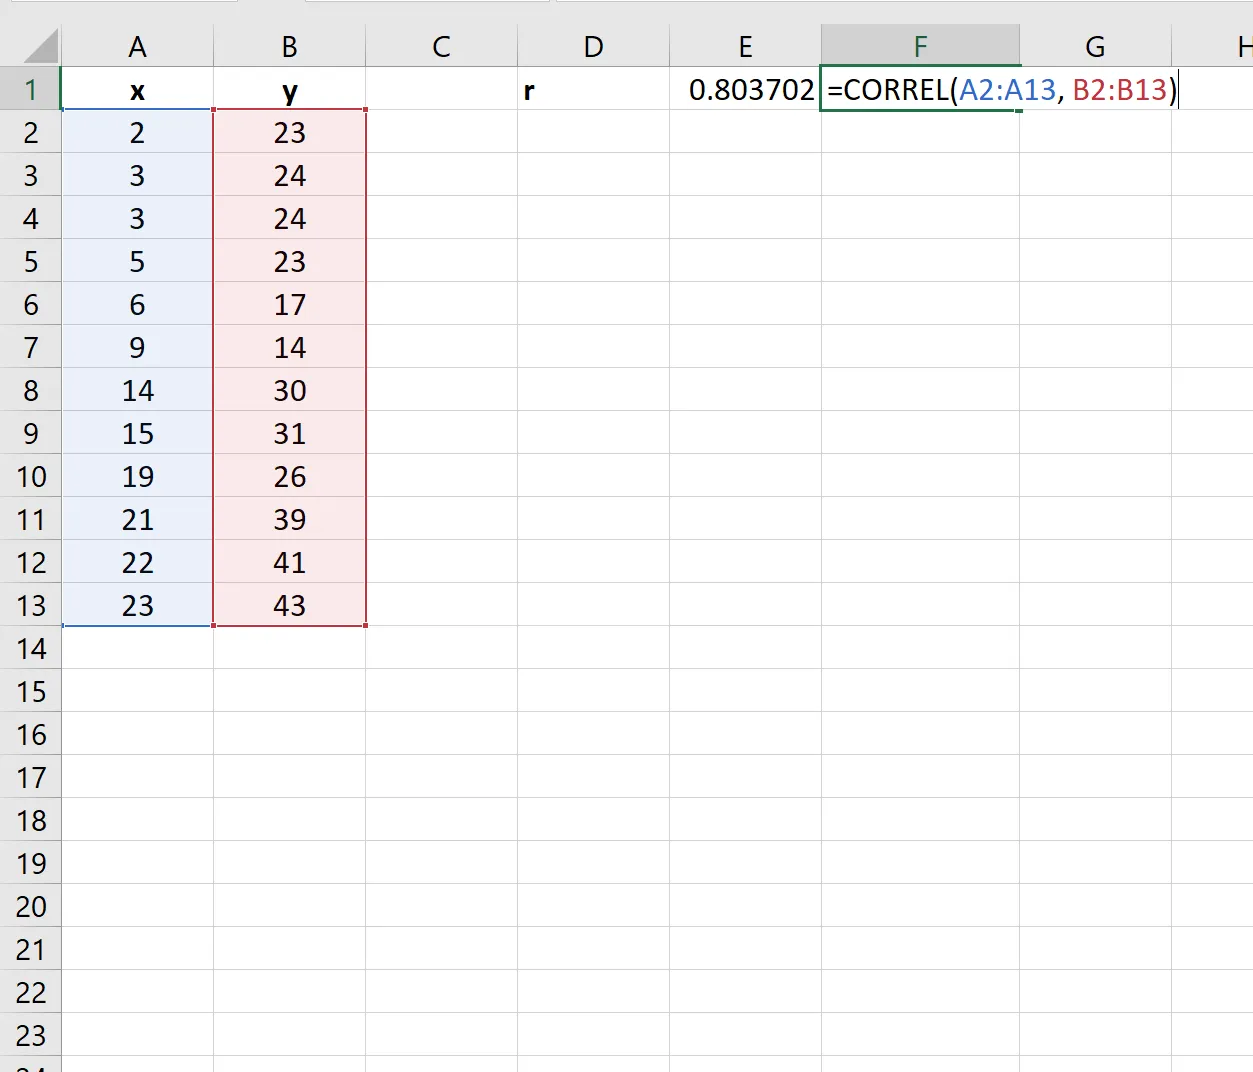
As demonstrated in the example, the calculated correlation coefficient is approximately 0.803702. While this indicates a strong positive correlation, further statistical testing is necessary to confirm its significance. This involves calculating the t-score and p-value, which can be done using the CORREL() function. For more advanced matrix analysis, understanding how to create a correlation matrix in Excel can be beneficial.
Step 3: Calculate the Test Statistic and P-Value
To determine statistical significance, calculate the test statistic (t-score) and its corresponding p-value. Excel allows you to perform these calculations using specific formulas, often in conjunction with the T.DIST.2T() function for the p-value, referencing the calculated t-score and degrees of freedom (sample size minus 2).
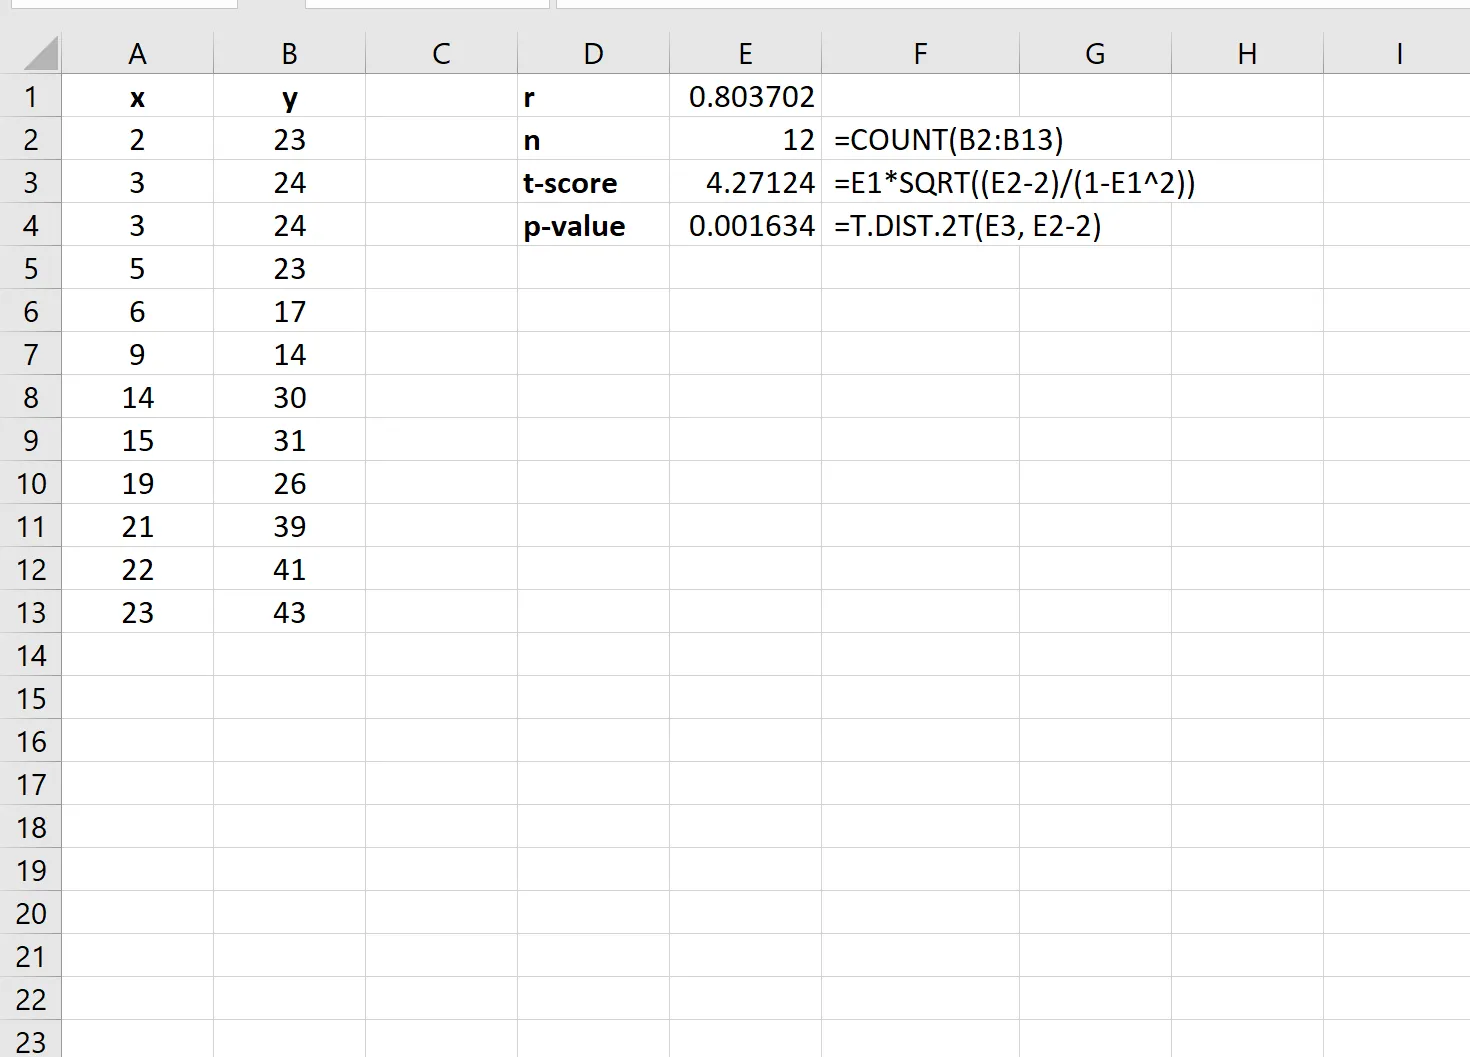
In the provided example, the test statistic is calculated as 4.27124, and the resulting p-value is 0.001634. Given that this p-value is significantly less than the conventional significance level of 0.05, we can conclude that there is statistically significant evidence of a correlation between the two variables. Exploring different correlation methods, such as how to calculate Spearman rank correlation in Excel, can offer alternative perspectives on data relationships.
Conclusion
Performing a correlation test in Excel provides a clear method for assessing the linear relationship between two variables and determining its statistical significance. By following the steps outlined above, you can calculate the correlation coefficient, t-score, and p-value to draw meaningful conclusions from your data. For ongoing analysis, consider learning how to calculate rolling correlation in Excel to track correlations over time. This process empowers you to make more informed data-driven decisions.